India's current account deficit zooms to $10.7 billion in Q1 2008-09
30 Sep 2008
Mumbai: The current account deficit of the country widened to $10.72 billion in the April-June quarter from $1.04 billion three months earlier following the sharp rise in oil prices, the Reserve Bank of India (RBI) said in a release.
The RBI said the balance of payments surplus in the April-June quarter was $2.24 billion, down sharply from a surplus of $24.99 billion in January-March.
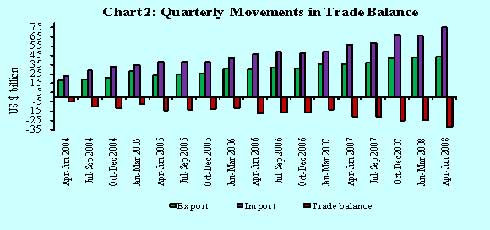
The merchandise trade deficit on a balance of payment basis widened by more than 50 per cent to $31.6 billion in April-June from $20.7 billion in the same period last year, as high oil prices boosted the value of imports.
India's merchandise exports witnessed a higher growth at 22.2 per cent in Q1 of 2008-09 than the 20.7 per cent in Q1 of 2007-08. Import payments also increased substantially and recorded 33.3 per cent growth in Q1 of 2008-09 (21.1 per cent in Q1 of 2007-08), according to data released by Directorate General of Commercial Intelligence and Statistics (DGCI&S).
While oil imports recorded a significant growth of 50.4 per cent in Q1 of 2008-09 (23.9 per cent in Q1 of 2007-08), non-oil imports showed relatively a modest growth of 20.9 per cent (45.1 per cent in Q1 of 2007-08).
Oil imports in Q1 of 2008-09 accounted for about 35 per cent of total imports (30 per cent in Q1 of 2007-08).
Out of total increase in imports of $16.8 billion in the Q1 of 2008-09 over the Q1 of 2007-08, the oil imports contributed an increase of $8.6 billion (51.0 per cent as against 21.1 per cent in Q1 of 2007-08), while non-oil imports contributed an increase of $8.2 billion (49.0 per cent as against 78.9 per cent in Q1 of 2007-08).
The sharp increase in oil imports reflected the impact of increasing oil price of the Indian basket of international crude (a mix of Oman, Dubai and Brent varieties), which increased to US $ 118.8 per barrel in Q1 of 2008-09 from US $ 66.4 per barrel in the corresponding quarter of the previous year
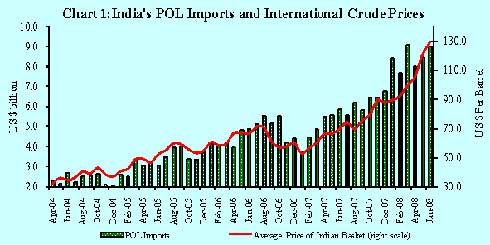
The trade deficit rose sharply to $31.6 billion in Q1 of 2008-09 ($20.7 billion in Q1 of 2007-08) mainly on account of higher growth in import payments
Invisible receipts, comprising services, current transfers and income, rose by 29.7 per cent in Q1 of 2008-09 (16.7 per cent in Q1 of 2007-08) mainly due to increase in receipts under private transfers along with the steady growth in software services exports, travel and transportation.
Private transfers mainly consist of (i) Inward remittances from Indian workers abroad for family maintenance, (ii) Local withdrawal from Non-Resident Indian Rupee deposits, (iii) Gold and silver brought through passenger baggage, and (iv) Personal gifts/donations to charitable/religious institutions.
Private transfer receipts, comprising mainly remittances from Indians working overseas, increased to $12 billion in Q1 of 2008-09 as compared to $7.8 billion in Q1 of 2007-08. Private transfer receipts constituted 14.8 per cent of current receipts in Q1 of 2008-09 (12.0 per cent in Q1 of 2007-08).
Under Private transfer, the inward remittances for family maintenance accounted for about 53 per cent of the total private transfer receipts, while local withdrawals accounted for about 42 per cent in Q1 of 2008-09.
NRI deposits when withdrawn domestically, form part of private transfers because once withdrawn for local use these become unilateral transfers and do not have any quid pro quo, e.g. grants, gifts, and migrants' transfers by way of remittances for family maintenance, repatriation of savings and transfer of financial and real resources linked to change in resident status of migrants.
Under NRI deposits, both inflows as well as outflows remained steady in the recent past. A major part of outflows from NRI deposits is in the form of local withdrawals. During Q1 of 2008-09, the share of local withdrawals in total outflows from NRI deposits was 61.0 per cent (61.4 per cent in Q1 of 2007-08).
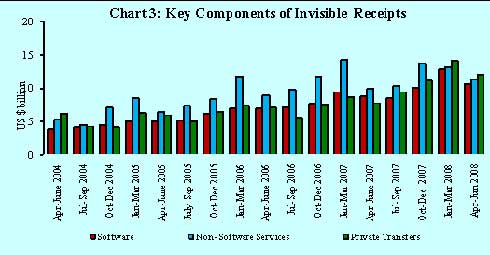
Software services exports at $10.7 billion in Q1 of 2008-09 ($8.8 billion in Q1 of 2007-08) recorded a growth of 20.6 per cent (25.5 per cent in Q1 of 2007-08).
Miscellaneous receipts, excluding software exports, stood at $5.9 billion in Q1 of 2008-09 ($5.5 billion in Q1 of 2007-08).
Business services receipts mainly include trade related services, business and management consultancy services, architectural and engineering services and other technical services, and office maintenance services. These reflect the underlying momentum in trade of professional and technology related services.
Reflecting the accretion to reserves, investment income receipts rose by 51.6 per cent in Q1 of 2008-09 as against 35.9 per cent in Q1 of 2007-08.
Invisible payments showed an increase of 14.8 per cent in Q1 of 2008-09 (22.6 per cent in Q1 of 2007-08). The invisible payments comprise payments relating to those of travel, transportation, business and management consultancy, engineering and other technical services, dividends, profit and interest payments. The moderation in growth rate of invisible payments during Q1 of 2008-09 was mainly due to moderate payments relating to a number of business and professional services.
Reflecting the rising volume of imports, transportation payments in Q1 of 2008-09 were higher by 33.1 per cent than that of 24.8 per cent in Q1 of 2007-08. In addition, the higher payments may also be attributed to the rising freight rates on international shipping due to surge in international crude oil prices.
The business services payments comprise payments related to the trade related services, business and management consultancy services, architectural, engineering and other technical services and the services relating to maintenance of offices.
Investment income payments, representing the interest payments on commercial borrowings, external assistance and non-resident deposits, and reinvested earnings of the foreign direct investment (FDI) enterprises operating in India, amounted to US $ 4.4 billion in Q1 of 2008-09 as compared with US $ 4.0 billion in Q1 of 2007-08.
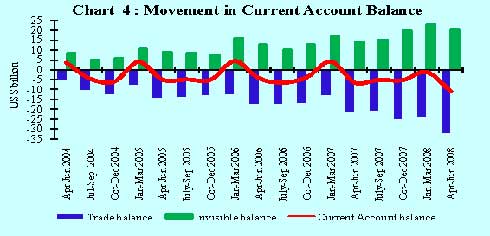
Net invisibles (invisibles receipts minus invisibles payments) stood at $20.9 billion during Q1 of 2008-09 ($14.4 billion in Q1 of 2007-08) mainly led by higher growth in private transfers and software exports. At this level, the invisible surplus financed about 66.0 per cent of trade deficit in the Q1 of 2008-09 as against 69.6 per cent in Q1 of 2007-08.
Despite higher net invisible surplus mainly emanating from private transfers and software exports, the widening trade deficit mainly due to higher imports led to higher current account deficit at $10.7 billion in Q1 of 2008-09 ($6.3 billion in Q1 of 2007-08)
The balance of payments developments during Q1 of 2008-09 were dominated by both gross capital inflows as well as outflows. The gross capital inflows to India during Q1 of 2008-09 amounted to $88.4 billion ($68.5 billion in Q1 of 2007-08) as against an outflow of $75.2 billion ($51.2 billion in Q1 of 2007-08).
Reflecting volatile movement of capital flows, the net capital flows were lower at $13.2 billion in Q1 of 2008-09 than that of $17.3 billion in Q1 of 2007-08.
Foreign direct investments (FDI) broadly comprise equity, reinvested earnings and inter-corporate loans. Net FDI flows (net inward FDI minus net outward FDI) were higher at $10.1 billion in Q1 of 2008-09 as against $2.7 billion in Q1 of 2007-08. Net inward FDI remained buoyant at $12.1 billion during Q1 of 2008-09 ($7.0 billion in Q1 of 2007-08) reflecting the continuing pace of expansion of domestic activities, positive investment climate and continuing liberalisation measures to attract FDI. FDI was channeled mainly into manufacturing (23.6 per cent) followed by construction sector (18.9 per cent) and financial services (14.4 per cent). Net outward FDI moderated to $2.0 billion in Q1 of 2008-09 ($4.3 billion in Q1 of 2007-08) reflecting the slowdown in global business activities.
Portfolio investment primarily comprising foreign institutional investors' (FIIs) investments and American Depository Receipts (ADRs)/Global Depository Receipts (GDRs) witnessed large net outflows ($4.2 billion) in Q1 of 2008-09 (net inflows of $7.5 billion in Q1 of 2007-08) due to large sales of equities by FIIs in the Indian stock market reflecting bearish condition in stock market and slowdown in the global economy. The inflows under ADRs/ GDRs amounted to $999 million in Q1 of 2008-09 ($316 million in Q1 of 2007-08).
The net external commercial borrowing (ECB) inflows (disbursements/inflows minus repayments/outflows) to India amounted to $1.3 billion in Q1 of 2008-09 ($6.9 billion in Q1 of 2007-08). Net ECB inflows were lower at 11.8 per cent of net capital flows during Q1 of 2008-09 as against 40.3 per cent of net capital flows in Q1 of 2007-08.
Banking capital primarily represents foreign assets and foreign liabilities of commercial banks (ADs). Among the components of banking capital, Non-Resident Indian (NRI) deposits witnessed a net inflow of $813 million in Q1 of 2008-09, a turnaround from net outflow of $447 million in Q1 of 2007-08.
Banking capital, excluding NRI deposits, registered higher net inflows at $1.9 billion during Q1 of 2008-09 (net outflows of $0.5 billion in Q1 of 2007-08). The net inflows under commercial banks assets in Q1 of 2008-09 primarily reflected the drawdown of assets held abroad by the Indian banks while the net inflows under commercial banks liabilities was mainly due to the overseas borrowings of the banks.
Net short term trade credit was at $2.2 billion (inclusive of suppliers' credit up to 180 days) during the Q1 of 2008-09 as against $1.8 billion during the same period of the previous year. Out of total short-term trade credit, the suppliers' credit up to 180 days amounted to $0.7 billion during Q1 of 2008-09 ($0.7 billion in Q1 of 2007-08).
Items under 'Other Capital' include leads and lags in exports, funds held abroad, advances received pending issue of shares under FDI and other capital receipts not included elsewhere (n.i.e). Net other capital receipts amounted to $518 million in Q1 of 2008-09.
The net accretion to foreign exchange reserves on BoP basis (ie, excluding valuation) was $2.2 billion in Q1 of 2008-09 ($11.2 billion in Q1 of 2007-08).
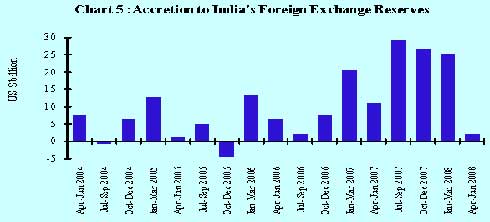
Taking into account the valuation gain, foreign exchange reserves recorded an increase of $2.4 billion in Q1 of 2008-09 ($14.2 billion in Q1 of 2007-08).
At the end of June 2008, with outstanding foreign exchange reserves at $312.1 billion, India held the third largest stock of reserves among the emerging market economies.