India's economic growth slumped to a six-year low at 5.3 per cent in October-December 2008-09
27 Feb 2009
India's economic growth slowed more than expected in the third quarter of the current fiscal 2008-09, slumping to a six-year low at 5.3 per cent, reflecting a slowdown in both industrial and agricultural output, official data showed.
Gross domestic product at constant (1999-2000) prices rose to Rs8,73,426 crore in the third quarter of fiscal 2008-09, as against Rs8,29,172 crore in the same quarter of the previous year (2007-08), showing a growth rate of 5.3 per cent over the corresponding quarter of previous year, according to the Central Statistical Organisation (CSO).
 The economic activities which registered significant growth in the third quarter of 2008-09 are, 'mining and quarrying' at 5.3 per cent, 'construction' at 6.7 per cent, 'trade, hotels, transport and communication' at 6.8 per cent, 'financing, insurance, real estate and business services' at 9.5 per cent, and 'community, social and personal services' at 17.3 per cent.
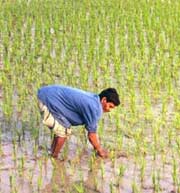
'Agriculture, forestry and fishing', and 'manufacturing' registered negative growth at (-) 2.2 per cent and (-) 0.2 per cent, respectively during the period.
According to the second advance estimates of production of crops released on 12 February by the department of agriculture and cooperation (DAC), rice, coarse cereals and pulses recorded growth rates of 3.4 per cent, (-) 13.2 per cent, and (-) 24.7 per cent, respectively during the Kharif season of 2008-09 over the corresponding season in the previous agriculture year.
Among commercial crops, production of oilseeds declined by 21.2 per cent during the Kharif season of 2008-09. Production of cotton and sugarcane is also estimated to decline by 14.4 per cent and 16.6 per cent, respectively during the agriculture year 2008-09. However, horticultural crops, livestock products and fisheries are expected to grow at 6.0 per cent in, 5.5 per cent and 6.0 per cent, respectively.
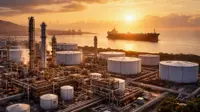
According to the latest estimates of the index of industrial production (IIP), the index of mining, manufacturing and electricity, registered growth rates of 1.5 per cent, (-) 0.7 per cent and 2.9 per cent, respectively in Q3 of 2008-09, as compared to the growth rates of 5.5 per cent, 8.9 per cent and 4.6 per cent in these sectors in Q3 of 2007-08. In the mining sector. Production of coal and crude oil registered growth rates of 9.9 per cent and zero per cent in Q3 of 2008-09, as against the growth rates of 8.3 per cent and (-) 0.4 per cent in Q3 of 2007-08.
The key indicators of construction sector, namely, cement and finished steel registered growth rates of 8.8 per cent and (-) 1.7 per cent, respectively in Q3 of 2008-09, as against the growth rates of 5.7 per cent and 3.9 per cent, respectively in Q3 of 2007-08.
Among the services sectors, the key indicators of railways, namely, the net tonne kilometers and passenger kilometers have shown growth rates of 0.5 per cent and 10.1 per cent, respectively in Q3 of 2008-09, as against the growth rates of 8.6 per cent and 6.2 per cent, in the corresponding period of previous year.
In the transport and communication sectors, the production of commercial vehicles, cargo handled at major ports, cargo handled by the civil aviation, passengers handled by the civil aviation and the total stock of telephone connections (including WLL and cellular) registered growth rates of (-) 52.4 per cent, (-) 3.4 per cent, (-) 6.4 per cent, (-) 12.2 per cent and 41.0 per cent, respectively in Q3 of 2008-09 over Q3 of 2007-08.
Aggregate bank deposits, bank credits and revenue expenditure of central government excluding interest payments have shown growth rates of 20.8 per cent, 23.1 per cent, and 50.5 per cent respectively during April-December, 2008-09 over the corresponding period in 2007-08.
GDP at factor cost at current prices in Q3 of 2008-09, is estimated at Rs 13,04,468 crore, as against Rs11,43,862 crore in Q3, 2007-08, showing an increase of 14.0 per cent.
The wholesale price index (WPI), in respect of the groups, food articles, non-food articles, fish, minerals, manufactured products, electricity and all commodities, has risen by 10.1 per cent, 12.4 per cent, 5.3 per cent, 14.4 per cent, 8.0 per cent, 1.4 per cent, and 8.7 per cent, respectively during Q3 of 2008-09, over Q3 of 2007-08. The consumer price index for industrial workers (CPIIW) has shown a rise of 10.2 per cent during Q3 of 2008-09 over Q3 of 2007-08.
Private final consumption expenditure (PFCE) at current prices is estimated at Rs8,21,043 crore in Q3 of 2008-09 as against Rs7,14,791 crore in Q3 of 2007-08. At constant (1999-2000) prices, the PFCE is estimated at Rs5,59,412 crore in Q3 of 2008-09 as against Rs5,30,913 crore in Q3 of 2007-08.
In terms of GDP at market prices, the rates of PFCE at current and constant (1999-2000) prices during Q3 of 2008-09 are estimated at 58.5 per cent and 59.5 per cent, respectively, as against the corresponding rates of 57.1 per cent and 59.0 per cent, respectively in Q3 of 2007-08.
Government final consumption expenditure (GFCE) at current prices is estimated at Rs1,50,198 crore in Q3 of 2008-09 as against Rs1,09,432 crore in Q3 of 2007-08. At constant (1999-2000) prices, the GFCE is estimated at Rs93,939 crore in Q3 of 2008-09 as against Rs75,363 crore in Q3 of 2007-08.
In terms of GDP at market prices, the rates of GFCE at current and constant (1999-2000) prices during Q3 of 2008-09 are estimated at 10.7 per cent and 10.0 per cent, respectively, as against the corresponding rates of 8.7 per cent and 8.4 per cent, respectively in Q3 of 2007-08.
Gross fixed capital formation (GFCF) at current prices is estimated at Rs4,68,195 crore in Q3 of 2008-09 as against Rs4,13,518 crore in Q3 of 2007-08. At constant (1999-2000) prices, the GFCF is estimated at Rs2,91,468 crore in Q3 of 2008-09 as against Rs2,76,803 crore in Q3 of 2007-08.
In terms of GDP at market prices, the rates of GFCF at current and constant (1999-2000) prices during Q3 of 2008-09 are estimated at 33.4 per cent and 31.0 per cent, respectively, as against the corresponding rates of 33.0 per cent and 30.8 per cent, respectively in Q3 of 2007-08.