Semiconductor sales pick up partly due to spurt in PC market
07 Jan 2010
Worldwide sales of semiconductors rose to $22.6 billion in November, a 3.7 per cent increase from October sales of $21.8 billion, the Semiconductor Industry Association (SIA) reported this week in its SIA Global Sales Report.
The Global Sales Report is a three-month moving average of sales activity, tabulated by the World Semiconductor Trade Statistics (WSTS) organisation. The moving average is a mathematical smoothing technique that mitigates variations due to differences in companies' financial calendars.
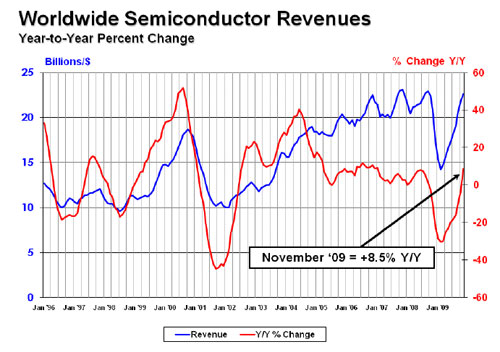
Though sales were 8.5 per cent higher than November 2008 of $20.9 billion, sales for the first 11 months of 2009 declined 13.2 per cent to $202.1 billion compared to sales of $232.7 billion in the first 11 months of 2008.
''For the first time in 2009, worldwide semiconductor sales in November were in positive territory compared to one year ago,'' said SIA president George Scalise.
''2009 ended with sales of many IT and consumer products faring better than earlier projections, he added.
Scalise credited the rising sales to greater demand for IT products. "Sales of personal computers continue to strengthen … and appear to signal the beginning of recovery of demand from the business sector," he suggested.
SIA release was supported by data released by research firm IDC in mid-December, which said that the global PC market grew 2.4 per cent in the third quarter of 2009, even though desktop PC sales fell year-on-year.
IDC analyst Richard Shim reported, a "resurgence of PC shipments into the commercial market segment" is expected this year.
The release of the Windows 7 operating system in October had been a positive factor. Unit sales of handsets should come in roughly even with 2008 levels.
In the consumer space, there have been a few bright spots including LCD TVs, which saw an increase of 25-30 percent in units in 2009.
''With a sequential increase of 3.7 per cent, November was the ninth-consecutive month of increased chip sales. Sales increased sequentially in all geographic regions,'' Scalise concluded.
| November 2009 | |||
| Billions | |||
| Month-to-Month Sales | |||
| Market | Last Month | Current Month | % Change |
| Americas | 3.66 | 3.88 | 6.0% |
| Europe | 2.80 | 3.02 | 7.7% |
| Japan | 3.74 | 3.84 | 2.7% |
| Asia Pacific | 11.64 | 11.92 | 2.4% |
| Total | 21.83 | 22.65 | 3.7% |
| Year-to-Year Sales | |||
| Market | Last Month | Current Month | % Change |
| Americas | 3.08 | 3.88 | 25.9% |
| Europe | 3.17 | 3.02 | -4.9% |
| Japan | 4.05 | 3.84 | -5.3% |
| Asia Pacific | 10.57 | 11.92 | 12.8% |
| Total | 20.87 | 22.65 | 8.5% |
| Three-Month-Moving Average Sales | |||
| Market | Jun / Jul / Aug | Sep / Oct / Nov | % Change |
| Americas | 3.26 | 3.88 | 19.0% |
| Europe | 2.40 | 3.02 | 25.7% |
| Japan | 3.35 | 3.84 | 14.4% |
| Asia Pacific | 10.17 | 11.92 | 17.2% |
| Total | 19.17 | 22.65 | 18.1% |