Centre of gravity of the urban world shifting to India, China: McKinsey
05 Apr 2011
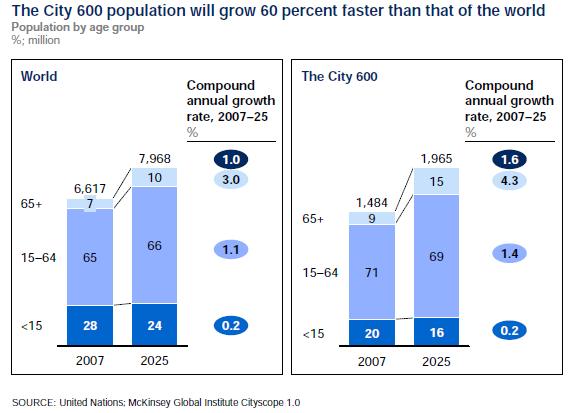
Over the next fifteen years, the centre of gravity of the urban world will not only move south but, even more decisively, it will move east as rapid urbanisation in India and China changes the global urban landscape, predicts a new report by the McKinsey Global Institute (MGI).
 Today, half of the world's population lives in cities, generating more than 80 per cent of global GDP. But 60 per cent of global GDP is generated by 600 urban centres, with only a fifth of the world's population.
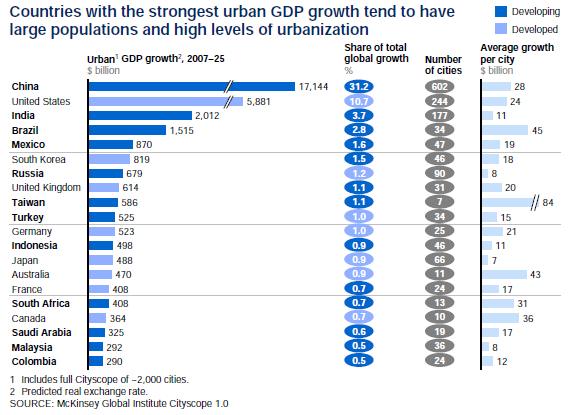
In 2007, for instance, 380 cities in the developed world (including 190 in North America) accounted for 20 per cent of global GDP. The MGI report, 'Urban world: Mapping the economic power of cities', predicts that by 2025, a third of these developed market cities will no longer make it to the top 600. One out of every 20 cities in emerging markets is likely to drop out of the top 600. By then, 136 new cities are expected to enter the top 600, all of them from the developing world, including 100 from China and 13 from India.
By 2025, the top 600 cities will account for about 60 per cent of global GDP, says the McKinsey report. ''The earth's urban landscape appears to be stable, but its centre of gravity is shifting decisively, and at speed,'' notes the report. ''Companies trying to identify the most promising growth opportunities need to be able to map this movement and spot the individual cities where their businesses are most likely to thrive.''
By 2025, according to MGI, two billion people – representing 25 per cent of humanity – will be living in the top 600 cities in the world. These cities will account for $64 trillion in GDP, nearly 60 per cent of global GDP. Interestingly, 735 million households will live in these cities with average per capita GDP of $32,000. Of these, 235 million households in the developing world cities will have income above $20,000 per annum.
According to MGI, the new cities most likely to emerge as urban economic hubs are Harbin, Shantou and Guiyang in China; Hyderabad, Ahmedabad and Surat in India and Cancun and Barranquilla in Latin America.
The report warns that though it made sense for companies to focus on mega cities (with population of 10 million-plus) in the developed world and in the emerging markets all these years, as they contribute to more than 70 per cent of global GDP today, ''…these regions and very large cities in developing economies are likely to generate only an estimated one-third of global growth to 2025.''
''A strategy focused on this combination will be insufficient for companies seeking growth.''
According to the report, it is a common misperception that mega cities have been driving global growth for the past 15 years. ''In fact, most have not grown faster than their host economies, and MGI expects this trend to continue. Today's 23 mega cities will contribute about 10 per cent of global growth to 2025, below their 14 per cent share of global GDP.''
In contrast, 577 middle-weights – cities with populations of between 150,000 and 10 million – are seen contributing more than half of global growth to 2025, gaining share from today's mega cities. By 2025, 13 middle weights are expected to emerge as mega cities, 12 of which are in emerging markets (the exception is Chicago) and seven in China alone.
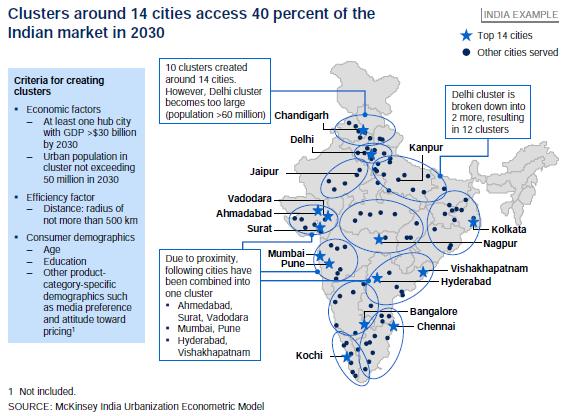
Focussing on the infrastructure opportunities in India and China, the report notes that both countries will need ''to build infrastructure on a grand scale to meet the needs of their surging urban populations.'' India needs to step up its construction of urban infrastructure sharply to bridge the gap between demand for services and their provision.
MGI estimates that India needs to invest $1.2 trillion in capital expenditure in its cities over the next 20 years, equivalent to $134 per capita per year – almost eight times the level of spending today in per capita terms. More than half of the capital investment is necessary to erase India's infrastructure backlog and the rest to fund cities' future needs.
Transportation and affordable housing stand out as the two most capital-intensive sectors. India could potentially need to build 700 million to 900 million square metres of new residential and commercial space every year for the next 20 years, and China could require 1.6 billion to 1.9 billion square metres per year.
In the case of metro railways and subways, India could potentially have to construct nearly 350 to 400 km of new metro railways and subways per year, while China may need to construct 800 to 1,500 km each year, adds the report.
| Top 25 hot spots by 2025 | Bold text Developing regions | ||||||
| Cityscope 2025 city rankings | Normal text Developed regions1 | ||||||
| Rank | GDP2 | Per capita GDP2 | GDP growth2 | Total population | Children3 | Total house holds | Households with annual income over $20,0004 |
| 1 | New York | Oslo | Shanghai | Tokyo | Kinshasa | Tokyo | Tokyo |
| 2 | Tokyo | Doha | Beijing | Mumbai | Karachi | Shanghai | New York |
| 3 | Shanghai | Bergen | New York | Shanghai | Dhaka | Beijing | London |
| 4 | London | Macau | Tianjin | Beijing | Mumbai | São Paulo | Shanghai |
| 5 | Beijing | Trondheim | Chongqing | Delhi | Kolkata | Chongqing | Beijing |
| 6 | Los Angeles | Bridgeport | Shenzhen | Kolkata | Lagos | New York | Paris |
| 7 | Paris | Hwasong | Guangzhou | Dhaka | Delhi | London | Rhein-Ruhr |
| 8 | Chicago | Asan | Nanjing | São Paulo | Mexico City5 | Mumbai | Osaka |
| 9 | Rhein-Ruhr | San Jose | Hangzhou | Mexico City5 | New York | Delhi | Moscow |
| 10 | Shenzhen | Yosu | Chengdu | New York | Manila | MexicoCity5 | Mexico City5 |
| 11 | Tianjin | Calgary | Wuhan | Chongqing | Tokyo | Rhein-Ruhr | Los Angeles |
| 12 | Dallas | Al-Ayn | London | Karachi | Cairo | Paris | São Paulo |
| 13 | Washington, D.C. | Edinburgh | Los Angeles | Kinshasa | Lahore | Kolkata | Seoul |
| 14 | Houston | Charlotte | Foshan | London | São Paulo | Lagos | Chicago |
| 15 | São Paulo | San Francisco | Taipei | Lagos | Kabul | Osaka | Milan |
| 16 | Moscow | Durham | Delhi | Cairo | Buenos Aires | Dhaka | Mumbai |
| 17 | Chongqing | Ulsan | Moscow | Manila | Luanda | Tianjin | Cairo |
| 18 | Randstad | Washington, D.C. | Singapore | Shenzhen | London | Shenzhen | Hong Kong |
| 19 | Guangzhou | Boston | São Paulo | Los Angeles | Los Angeles | Moscow | Taipei |
| 20 | Mexico City5 | Belfast | Tokyo | Buenos Aires | Colombo | Chengdu | Randstad |
| 21 | Osaka | New York | Shenyang | Rio de Janeiro | Baghdad | Cairo | Shenzhen |
| 22 | Philadelphia | Grande Vitória | Xi'an | Tianjin | Shanghai | Rio de Janeiro | Istanbul |
| 23 | Boston | Canberra | Dongguan | Paris | Paris | Wuhan | Delhi |
| 24 | San Francisco | Seattle | Mumbai | Jakarta | Jakarta | Los Angeles | Buenos Aires |
| 25 | Hong Kong | Zurich | Hong Kong | Istanbul | Istanbul | Buenos Aires | Madrid |
| 1 Developed regions comprise the United States and Canada, Western Europe, Australasia, Japan, and South Korea. 2 GDP, per capita GDP in 2025, and GDP growth 2007 to 2025 in predicted real exchange rate. 3 Population below age 15. 4 Households with annual incomes greater than $20,000 in purchasing power parity (PPP) terms. 5 Mexico City Metropolitan Region. NOTE: For metropolitan regions, we use the first name of the region: e.g., New York for New York-Newark. SOURCE: McKinsey Global Institute Cityscope 1.0 | |||||||