With rising incomes global e-waste rises 8% by weight in two years: UN-backed report
14 Dec 2017
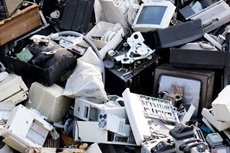
A new report on global e-waste - discarded products with a battery or plug - shows a staggering 44.7 million metric tonnes (Mt) generated in 2016 - up 3.3 Mt or 8 per cent from 2014.
 In 2016 the world generated e-waste - everything from end-of-life refrigerators and television sets to solar panels, mobile phones and computers - equal in weight to almost nine Great Pyramids of Giza, 4,500 Eiffel Towers, or 1.23 million fully loaded 18-wheel, 40-ton trucks, enough to form a line from New York to Bangkok and back.
Experts foresee a further 17 per cent increase - to 52.2 million metric tonnes of e-waste by 2021 - the fastest growing part of the world's domestic waste stream.
The Global E-waste Monitor 2017, released on Wednesday 13 December 2017, is a collaborative effort of the United Nations University (UNU), represented through its Sustainable Cycles (SCYCLE) Programme hosted by UNU's Vice-Rectorate in Europe, the International Telecommunication Union (ITU), and the International Solid Waste Association (ISWA).
Only 20 per cent of 2016's e-waste is documented to have been collected and recycled despite rich deposits of gold, silver, copper, platinum, palladium and other high value recoverable materials. The conservatively estimated value of recoverable materials in last year's e-waste was US $55 billion, which is more than the 2016 Gross Domestic Product of most countries in the world.
About 4 per cent of 2016's e-waste is known to have been thrown into landfills; 76 per cent or 34.1 Mt likely ended up incinerated, in landfills, recycled in informal (backyard) operations or remain stored in our households.
On a per capita basis, the report shows a rising trend as well.
Falling prices now make electronic and electrical devices affordable for most people worldwide while encouraging early equipment replacement or new acquisitions in wealthier countries.
As a result, the average worldwide per capita e-waste generated was 6.1 kilograms in 2016, up 5 per cent from 5.8kg in 2014.
The highest per capita e-waste generators (at 17.3 kilograms per inhabitant) were Australia, New Zealand and the other the nations of Oceania, with only 6 per cent formally collected and recycled.
Europe (including Russia) is the second largest generator of e-waste per inhabitant with an average of 16.6 kg per inhabitant. However, Europe has the highest collection rate (35 per cent).
The Americas generates 11.6 kg per inhabitant and collects only 17 per cent, comparable to the collection rate in Asia (15 per cent). However, at 4.2 kg per inhabitant, Asia generates only about one third of America's e-waste per capita.
Africa, meanwhile, generates 1.9 kg per inhabitant, with little information available on its collection rate.
The 3 EEE categories that contribute the most to e-waste are also growing the fastest
It is expected that the following three EEE categories, which already constitute 75 per cent of global e-waste by weight (33.6 Mt of 44.7 Mt), will also see the fastest growth:
Small equipment (ie. vacuum cleaners, microwaves, ventilation equipment, toasters, electric kettles, electric shavers, scales, calculators, radio sets, video cameras, electrical and electronic toys, small electrical and electronic tools, small medical devices, small monitoring and control instruments). In 2016: 16.8 Mt generated, with an annual growth rate of 4 per cent per year to 2020
Large equipment: (ie. washing machines, clothes dryers, dish-washing machines, electric stoves, large printing machines, copying equipment, photovoltaic panels). In 2016: 9.2 Mt generated, with an annual growth of 4 per cent per year to 2020
Temperature exchange equipment (ie. refrigerators, freezers, air conditioners, heat pumps). In 2016: 7.6 Mt generated, with an annual growth of 6 % per year to 2020
Expected to grow less quickly by weight due to miniaturization:
Small IT and telecommunication equipment (ie mobile phones, Global Positioning Systems (GPS), pocket calculators, routers, personal computers, printers, telephones). In 2016: 3.9 Mt generated, with an annual growth of 2 per cent per year to 2020
Little growth expected:
Lamps (ie. fluorescent lamps, high intensity discharge lamps, LED lamps). In 2016: 0.7 Mt generated, with an annual growth rate of 1 per cent per year to 2020
Expected to decline by weight in years to come:
Screens (ie. televisions, monitors, laptops, notebooks, tablets), with heavy CRT screens being replaced with flat panel displays. In 2016: 6.6 Mt generated, with an annual decline of 3 per cent per year to 2020
Each product within the six e-waste categories has a different lifetime profile, which means that each category has different waste quantities, economic values, and potential environmental and health impacts if recycled inappropriately.
Consequently, the collection and logistical processes and recycling technology differ for each category. European studies show consumers' attitudes when disposing of types of electrical and electronic equipment also vary.
Fastest growth of EEE sales in developing countries
Higher disposable incomes in many developing countries is evidenced in sales of electronic and electrical equipment. EEE sales in general showed rapid growth from 2000 to 2016, with the fastest growth recorded in emerging economies with low Purchasing Power Parity (PPP).
- Countries with the highest Purchasing Power Parity (PPP) averaged 1.6% annual EEE growth
- Countries with high PPP averaged 5.2 per cent annual growth
- Countries with mid PPP averaged 13 per cent annual growth
- Countries with low PPP averaged 23 per cent annual growth
- Countries with the lowest PPP averaged 15 per cent annual growth
More mobile-cellular subscriptions than people on Earth
The report notes several trends and factors fuelling the global growth of information and communication-related electrical and electronic equipment, most notably the increasing number of applications and services in such areas as health, education, government, entertainment, and commerce, delivered at increasingly high speeds attracting more users to a growing number of networks.
The report notes that:
- With a population of 7.4 billion, the world now has 7.7 billion mobile-cellular subscriptions. More than 8 in 10 people on Earth are covered by a mobile broadband signal
- Some 3.6 billion people - close to half the world's population (45.9 per cent) now use the Internet, up from 20.5 per cent in 2007. Roughly half of humanity has a computer and Internet access at home. Some 48 per cent of households have a computer (up from 30.2 per cent in 2007) and 54 per cent have Internet access (up from 23 per cent in 2007)
- In addition to basic prepaid mobile cellular services and handsets becoming more affordable worldwide, prices are falling for many other types of equipment such as computers, peripheral equipment, TVs, laptops and printers
- With the recent conversion from analogue to digital broadcasting, many TV sets were unnecessarily trashed. While analogue televisions can receive digital signals simply by using a digital box, many consumers chose to upgrade, leaving the world with mountains of discarded Carbon-Ray-Tube TVs
- By 2016 in the United States, most people owned a phone; every second person owned a desktop computer; close to 25 per cent also owned an e-book reader. Between 2012 and 2015, the proportion of adult Americans who owned a smartphone, a computer, and a tablet doubled to 36 per cent
- Between 2013 and 2015, smartphone users started to delay their phone upgrades but the average smartphone lifecycle in the USA, China, and major EU economies does not typically exceed one and a half to two years
- The weight of all the chargers for mobile phones, laptops et cetera, now produced each year is estimated at 1 million tons, highlighting the need to make power adapters compatible with more devices, following universal standards developed and promoted by the ITU.
Needed: More recycling and global harmonized e-waste measurement and standards
The report calls for stepped up global efforts to better design of components in electrical and electronic equipment to facilitate reuse and recycling (EEE), greater capture and recycling of old (EEE), and better tracking of e-waste and the resource recovery process.
Encouragingly, more countries are adopting e-waste legislation, the report says. Today 66% of the world's people, living in 67 countries, are covered by national e-waste management laws (up from 44% in 61 countries in 2014), an increase caused mainly by India's adoption of legislation last year.
Still, only 41 countries quantify their e-waste generation and recycling streams officially and "the fate of a large majority of e-waste (34.1 of 44.7 Mt) is simply unknown."
Notes the report: "Having a national e-waste management regime in place does not always correspond to enforcement and setting the measurable collection and recycling targets essential for effective policies."
In countries where there is no national e-waste legislation in place, e-waste is likely treated as any other waste, leading to a high risk that toxic elements in e-waste are improperly managed, sometimes scavenged for e.g. copper or gold by informal enterprises without proper worker protections.
Meanwhile, the type of e-waste covered by legislation differs considerably throughout the world, highlighting the need for harmonization.
"Without better statistics on e-waste, and closing the main data gaps of current e-waste statistics, it is impossible to measure the effectiveness of existing and new legislation to show any potential improvements in the future" the report says.
Such data is also needed to better track illegal international movements of e-waste from richer to poor regions in the world.