AUM rises for the second consecutive month in May
08 Jun 2012
The mutual fund industry's month-end assets under management (AUM) rose for the second consecutive month to close marginally below the Rs7 trillion mark (Rs6.99 trillion) in May, gaining around 3per cent or Rs 191 billion (Table 1). The AUM rise was mainly due to inflows into money market / liquid funds; equity and income funds too witnessed inflows.
Equity funds witness net inflows but assets decline
Equity funds witnessed a net inflow of Rs4 billion in the month but assets declined on mark to market losses. Month end assets of equity funds declined by Rs92 billion to Rs1.70 trillion - a fall of 5 per cent - at the end of May as the underlying equity markets represented by the benchmark S&P CNX Nifty fell by over 6 per cent in May, dragged down by weak global and domestic cues.
Liquid funds corner majority of inflows in the industry
Money market /liquid funds saw net inflow of Rs250 billion, garnering around 94 per cent of the total inflow of Rs267 billion seen by the industry in the month. However, the inflows were sharply lower compared to Rs 758 billion seen by the industry in April 2012.
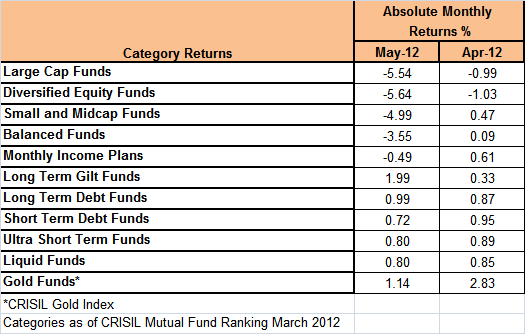
The assets in this category were up by 16 per cent to R 1.83 trillion as of May 2012, the highest since May 2011. The average returns of the category were 0.80 per cent as of May compared to 0.85 per cent in the previous month (Table 2).
Income funds see inflows, share of FMPs rise
Income funds (including ultra short-term debt funds and fixed maturity plans or FMPs) continued to see inflows for the second month in a row.
The category logged inflows of around Rs16 billion in May, sharply lower than Rs179 billion seen in April. The category AUM rose by Rs37 billion to Rs3.13 trillion in the month which included Rs1.34 trillion AUM under FMPs.
The rising interest rates in the economy over the past two years have seen the share of FMPs in the category grow to 43 per cent in May 2012 from 8 per cent in May 2010. The current inflows in this category too are largely on account of FMP NFOs where investors are able to lock into higher yields.
Table 1 – Month-on-Month Mutual Fund Flows and AUM distribution
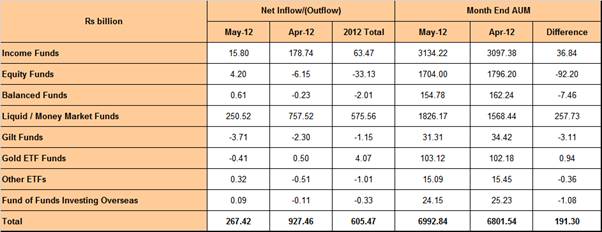
Table 2 – Mutual Fund Category Returns