|
The Reserve Bank of India has released preliminary data on balance of payments (BoP) for the second quarter (July-September 2007) of the financial year 2007-08 with the partially revised data for the first quarter (April-June 2007) having been taken into account for compiling the BoP data for the first half of the current financial year i.e., April-September 2007. Full details of these data are set out in the standard format of BoP presentation in Statement I and Statement II. The revisions for the financial years 2005-06 and 2006-07, take into account the issue of potential overlap between business services and software services. Accordingly, the data reported by the 'Authorized Dealers' (ADs) were reviewed and based on the feedback the revisions have been carried out in various components of business services. Hitherto, in India's balance of payments (BoP), suppliers' credit (credits for financing imports into India extended by the overseas supplier) up to 180 days were not covered explicitly. These data were implicitly included in the capital account under the heads 'other capital not included elsewhere' and the 'errors and omissions'. Now, these data are covered as a part of short-term trade credit to India with effect from financial year 2005-06 in the standard format of the BoP presentation and from end-March 2005 under the external debt. I. Balance of Payments (BoP) for July-September 2007 (Q2) The major items of the BoP for Q2 of 2007-08 are set out below in Table 1. | Table 1: Major Items of India's Balance of Payments (US $ million) | |
| Item | July-September | April-June | | 2007 (P) | 2006 (PR) | 2007 (PR) | 2006(PR) | | 1 | 2 | 3 | 4 | 5 | | 1. Exports | 37,875 | 31,836 | 35,790 | 29,614 | | 2. Imports | 59,586 | 48,593 | 56,480 | 46,631 | | 3. Trade Balance (1-2) | -21,711 | -16,757 | -20,690 | -17,017 | | 4. Invisibles, net | 16,195 | 10,482 | 15,493 | 12,952 | | 5. Current Account Balance (3+4) | -5,516 | -6,275 | -5,197 | -4,065 | | 6. Capital Account* | 34,752 | 8,545 | 16,397 | 10,444 | | 7. Change in Reserves#
(- Indicates increase) | -29,236 | -2,270 | -11,200 | -6,379 | | *: Including errors and omissions. #: On BoP basis excluding valuation.
P: Preliminary. PR: Partially Revised. | |
Merchandise Trade - On BoP basis, India's merchandise exports recorded a growth of 19.0 per cent in Q2 of 2007-08 as compared with 27.4 per cent in Q2 of the previous year.
- Import payments registered 22.6 per cent growth in Q2 of 2007-08 as against an increase of 26.5 per cent in Q2 of 2006-07.
- The deceleration in export growth, according to data released by the Directorate General of Commercial Intelligence and Statistics (DGCI&S), was mainly due to decline in exports of textiles and textile products coupled with the slowdown in exports of agricultural products, engineering goods and chemicals.
- According to the data released by the DGCI&S, although non-oil imports were higher by 25.3 per cent in Q2 of 2007-08 (18.1 per cent in Q2 of 2006-07) led by imports of capital goods and gold and silver, the total import growth was, however, lower due to deceleration in oil imports.
Trade Deficit - Consequent upon the deceleration in export growth and higher non-oil imports, as explained above, trade deficit on BoP basis was higher at US $ 21.7 billion in Q2 of 2007-08 (US $ 16.8 billion in Q2 of 2006-07).
Invisibles - Maintaining the pace of growth in remittances from overseas Indians, software services and other professional services, invisible receipts recorded a growth of 29.1 per cent in Q2 of 2007-08 as against 30.6 per cent in Q2 of 2006-07.
- Invisible payments reflected outbound tourist traffic from India, rising payments towards transportation, domestic demand for business related services and higher investment income payments in the form of interest payments and dividends.
Current Account Deficit - Despite widening of the trade deficit, the current account deficit (CAD) remained lower at US $ 5.5 billion in Q2 of 2007-08 (US $ 6.3 billion in Q2 of 2006-07) on account of higher invisible surplus (invisible receipts minus invisible payments) at US $ 16.2 billion (US $ 10.5 billion in Q2 of 2006-07).
Capital Account and Reserves - Under net capital flows, the major components were portfolio flows, external commercial borrowings (ECBs), banking capital and short-term trade credits.
- Net portfolio investment at US $ 10.9 billion in Q2 of 2007-08 (US $ 2.2 billion in Q2 of 2006-07) was the largest component of capital flows.
- Net Short term trade credit was higher at US $ 3.6 billion in Q2 of 2007-08 (US $ 2.7 billion in Q2 of 2006-07). As mentioned earlier, the data on suppliers' credit up to 180 days have now been included under the short-term trade credit from 2005-06 based on the international best practices (Box 1). Thus, out of total short-term trade credit (US $ 3.6 billion), the suppliers' credit up to 180 days amounted to US $ 0.9 billion in Q2 of 2007-08 (Table 2).
| Table 2: Net Flows under Suppliers' Credit up to 180 days (US $ million) | | Year/Quarter | Net flows | | 1 | 2 | | 2005-06 (April-March) | 1,974 | | April-June, 2005 | 752 | | July- September, 2005 | 1,142 | | October-December, 2005 | 239 | | January-March, 2006 | -159 | | 2006-07 (April-March) | 3,305 | | April-June, 2006 | 789 | | July-September, 2006 | 1,181 | | October-December, 2006 | 2,540 | | January-March, 2007 | -1,205 | | 2007-08 (April-September) | 1,906 | | April-June, 2007 | 1,034 | | July-September, 2007 | 872 | - Accretion to foreign exchange reserves on BoP basis (i.e., excluding valuation) at US $ 29.2 billion in Q2 of 2007-08 was significantly higher than that of US $ 2.3 billion in Q2 of 2006-07.
Box 1: Methodology for Estimation of the Suppliers' Credit up to 180 days Trade Credits refer to credits extended for imports directly by the overseas supplier, bank and financial institution. Depending on the source of finance, such trade credits include suppliers' credit or buyers' credit. Suppliers' credit relates to credit for imports in to India extended by the overseas supplier, while buyers' credit refers to loans for payment of imports into India arranged by the importer from a bank or financial institution outside India. As per international convention, trade credits up to one year are included under short term trade credit. In India's balance of payments (BoP), short term trade credit for imports included the buyers' credit and the suppliers' credit above 180 days. However, the suppliers' credit for imports up to 180 days was not covered explicitly. This was implicitly captured in the capital account under the heads 'other capital not included elsewhere' and the 'errors and omissions' and therefore, remained excluded from the short-term trade credit. According to the Balance of Payments Manual, Fifth edition (BPM5), International Monetary Fund, 1993 trade credits consist of claims and liabilities arising from the direct extension of the credit by suppliers and buyers for transaction of goods and services and advance payments for work in progress that is associated with such transactions. The BPM5 further notes that in the absence of actual data, trade credit may be measured by the difference between entries for the underlying transactions in goods and services, which are recorded as of the dates when ownership changes and the entries for payments related to these transactions. Regarding the country practices, Bank for International Settlements in a Survey (2002) noted that out of the 32 countries surveyed, 18 developing and 8 developed countries are compiling and publishing data on short-term trade credit as per the IMF Manual. In order to align with the international best practices in presenting the data on trade credit as part of BoP and external debt statistics, the data on suppliers' credit up to 180 days have been worked out using the internationally accepted methodology suggested in the BPM5. Under the reporting system in India, Authorized Dealers (ADs) report the payments made by them for import bills in the electronic data reporting to the Reserve Bank of India (RBI). Besides the value of imports, the date of shipment and the date of payment are also reported by the importers. On the basis of this information, the supplier's credit up to 180 days was estimated taking into account the difference between the date of shipment and the date of payment of imports. It may be noted that trade credits are recorded on a net basis (gross credit minus repayments) in the capital account. Conceptually, such trade credits are frequently short term in nature and get rolled over. Although the gross turnover in case of such trade credits may be relatively high, the outstanding amount at a given point of time appears to be relatively low. References:
(i) Bank for International Settlements (BIS) (2002), Comparison of Creditor and Debtor Data on Short-Term External Debt, BIS Paper No 13, December. (ii) International Monetary Fund (1993), Balance of Payments Manual, Fifth Edition. II. Balance of Payments (BoP) for April-September 2007 As alluded to earlier, taking into account the partially revised data for Q1 of 2007-08 and the preliminary data for Q2 of 2007-08, the BoP data for the first half of the financial year 2007-08 have been compiled. While the detailed data are set out in Statements I and II in standard format of BoP presentation, the major items are presented in Table 3. | Table 3: Major Items of India's Balance of Payments: April-September 2007 (US $ million) | | Item | April-September | April-March | | 2007-08 (P) | 2006-07 (PR) | 2006-07 (PR) | 2005-06(R) | | 1 | 2 | 3 | 4 | 5 | | 1. Exports | 73,665 | 61,450 | 128,083 | 105,152 | | 2. Imports | 116,066 | 95,224 | 191,254 | 157,056 | | 3. Trade Balance (1-2) | -42,401 | -33,774 | -63,171 | -51,904 | | 4. Invisibles, net | 31,688 | 23,434 | 53,405 | 42,002 | | 5. Current Account Balance (3+4) | -10,713 | -10,340 | -9,766 | -9,902 | | 6. Capital Account* | 51,149 | 18,989 | 46,372 | 24,954 | | 7. Change in Reserves#
(- Indicates increase) | -40,436 | -8,649 | -36,606 | -15,052 | | *: Including errors and omissions. #: On BoP basis excluding valuation.
P: Preliminary. PR: Partially Revised. R: Revised | Merchandise Trade - On BoP basis, merchandise exports recorded an increase of 19.9 per cent during April-September 2007 (25.4 per cent in the corresponding period of the previous year).
- On BoP basis, merchandise import payments showed 21.9 per cent growth in April-September 2007 as compared with 24.7 per cent in the corresponding period of the previous year.
- As mentioned earlier, the deceleration in exports, according to the commodity-wise data for April-August 2007 released by the DGCI&S, was mainly on account of decline in exports of textiles and textile products, and slowdown in exports of agricultural products, engineering goods, and chemicals.
- According to the data released by the DGCI&S, non-oil imports recorded a higher growth of 34.8 per cent during April-September 2007 (9.3 per cent in April-September 2006). The commodity-wise details available for April-August 2007-08 revealed that growth in imports of mainly export related items and gold and silver was higher than the previous year.
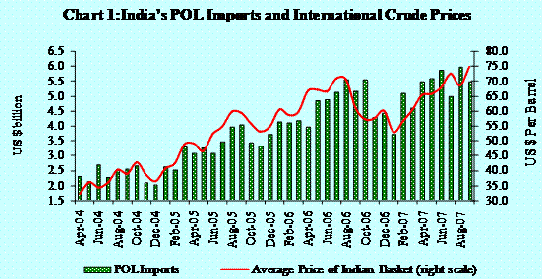
- Oil imports, as per the DGCI&S data, increased by 15.7 per cent in April-September 2007 (41.0 per cent in April-September 2006). The average price of the Indian basket of international crude (a mix of Dubai and Brent varieties) rose to US $ 69.2 per barrel in April-September 2007 from US $ 67.2 per barrel in the corresponding period of the previous year (Chart 1).
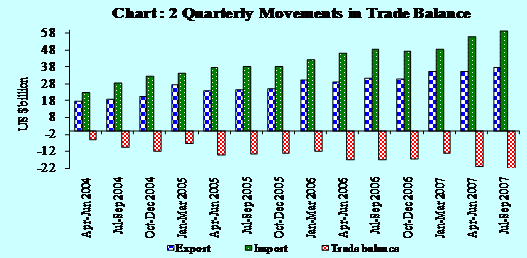
Trade Deficit - On BoP basis, the merchandise trade deficit widened to US $ 42.4 billion during April-September 2007 from US $ 33.8 billion in April-September 2006, on account of deceleration in export growth and higher non-oil imports (Chart 2).
Invisibles - Growth in invisible receipts showed a deceleration from 31.0 per cent in April-September 2006 to 23.4 per cent in April-September 2007 mainly on account of deceleration in exports of software and business services (Table 4 and Chart 3).
| Table 4: Invisible Gross Receipts and Payments: April-September 2007 | | (US $ million) | | Items | Invisible Receipts | Invisible Payments | | | 2007-08 | 2006-07 | 2006-07 | 2005-06 | 2007-08 | 2006-07 | 2006-07 | 2005-06 | | | April-
Sept | April-
Sept | April-
March | April-
March | April-
Sept | April-
Sept | April-
March | April-
March | | 1 | 2 | 3 | 4 | 5 | 6 | 7 | 8 | 9 | | 1. Travel | 4,336 | 3,504 | 9,123 | 7,853 | 3,960 | 3,300 | 6,685 | 6,638 | | 2. Transportation | 4,280 | 3,725 | 8,050 | 6,325 | 5,594 | 3,975 | 8,068 | 8,337 | | 3. Insurance | 788 | 553 | 1,202 | 1,062 | 475 | 283 | 642 | 1116 | | 4.Government not Included elsewhere | 167 | 101 | 250 | 314 | 245 | 201 | 403 | 529 | | 5. Transfers | 19,295 | 12,923 | 29,589 | 25,620 | 852 | 665 | 1,421 | 933 | | 6. Income | 6,431 | 3,954 | 9,304 | 6,408 | 7,875 | 7,275 | 15,877 | 12,263 | | Investment Income | 6,142 | 3,816 | 8,908 | 6,229 | 7,383 | 6,851 | 14,926 | 11,491 | | Compensation of Employees | 289 | 138 | 396 | 179 | 492 | 424 | 951 | 772 | | 7. Miscellaneous | 26,295 | 25,139 | 57,556 | 42,105 | 10,903 | 10,766 | 28,573 | 17,869 | | Of Which: Software | 16,317 | 14,160 | 31,300 | 23,600 | 1,220 | 820 | 2,267 | 858 | | Total (1 to 7) | 61,592 | 49,899 | 115,074 | 89,687 | 29,904 | 26,465 | 61,669 | 47,685 | - Private transfers, comprising primarily remittances from the Indians working overseas, were higher at US $ 19.0 billion (US $ 12.7 billion in April-September 2006) recording a growth of 49.2 per cent in April-September 2007 (15.0 per cent in April-September 2006).
- Reflecting the significant increase in the accretion to reserves, investment income receipts rose by 61.0 per cent during April-September 2007 on top of an increase of 45.9 per cent in April-September 2006.
- Software receipts at US $ 16.3 billion in April-September 2007 showed a lower growth of 15.2 per cent than that of 37.2 per cent in April-September 2006.
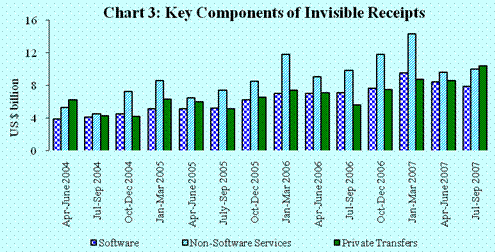
- The major components of invisible payments were travel payments, business service payments such as business and management consultancy, engineering and other technical services, and dividend and profit payments. Invisible payments grew by 13.0 per cent during April-September, 2007 as against 31.2 per cent in April-September 2006.
- The miscellaneous receipts, net of software, stood at around US $ 10.0 billion in April-September 2007 (US $ 11.0 billion in April-September 2006). The break-up of these data is presented in Table 5.
| Table 5: Break up of Non-Software Miscellaneous Receipts and Payments | | (US $ million) | | Item | Receipts | Payments | | | 2007-08 | 2006-07 | 2006-07 | 2005-06 | 2007-08 | 2006-07 | 2006-07 | 2005-06 | | | April-
Sept | April-
Sept | April-
March | April-
March | April-
Sept | April-
Sept | April-
March | April-
March | | 1 | 2 | 3 | 4 | 5 | 6 | 7 | 8 | 9 | 1. Communication
Services | 896 | 1,056 | 2,099 | 1,575 | 281 | 269 | 659 | 289 | | 2. Construction | 243 | 158 | 333 | 242 | 227 | 424 | 737 | 724 | | 3. Financial | 1,510 | 935 | 2,913 | 1,209 | 1,481 | 628 | 2,087 | 965 | | 4. News Agency | 237 | 147 | 334 | 185 | 212 | 74 | 218 | 131 | 5. Royalties,
Copyrights & License Fees | 79 | 32 | 97 | 191 | 368 | 353 | 1,038 | 594 | | 6. Business Services | 6,380 | 7,954 | 19,266 | 9,307 | 6,195 | 5,902 | 17,093 | 7,748 | 7. Personal, Cultural,
Recreational | 168 | 59 | 173 | 188 | 81 | 58 | 117 | 84 | | 8. Others | 465 | 638 | 1,041 | 5,608 | 838 | 2,238 | 4,357 | 6,476 | | Total (1 to 8) | 9,978 | 10,979 | 26,256 | 18,505 | 9,683 | 9,946 | 26,306 | 17,011 | - The key components of the business services receipts and payments were mainly the trade related services, business and management consultancy services, architectural, engineering and other technical services and services relating to maintenance of offices (Table 6).
| Table 6: Business Services | | (US $ million) | | Item | Receipts | Payments | | | 2007-08 | 2006-07 | 2006-07 | 2005-06 | 2007-08 | 2006-07 | 2006-07 | 2005-06 | | | April-
Sept | April-
Sept | April-
March | April-
March | April-
Sept | April-
Sept | April-
March | April-
March | | 1 | 2 | 3 | 4 | 5 | 6 | 7 | 8 | 9 | | 1. Trade Related | 788 | 345 | 940 | 406 | 684 | 548 | 1,655 | 1,206 | | 2. Business & Management Consultancy | 1,783 | 2,989 | 7,345 | 1,871 | 1,698 | 1,452 | 5,027 | 1,806 | 3. Architectural,
Engineering
and other technical | 1,392 | 2,329 | 6,134 | 2,428 | 973 | 1,194 | 3,674 | 1,414 | | 4. Maintenance of offices | 975 | 1,199 | 2,335 | 1,598 | 882 | 1,349 | 2,437 | 1,462 | | 5. Others | 1,442 | 1,092 | 2,512 | 3,004 | 1,958 | 1,359 | 4,300 | 1,860 | | Total | 6,380 | 7,954 | 19,266 | 9,307 | 6,195 | 5,902 | 17,093 | 7,748 | - The invisible surplus was higher at US $ 31.7 billion in April-September 2007 (US $ 23.4 billion in April-September 2006) reflecting mainly the rise in remittances from the overseas Indians, higher interest income on reserves and relatively moderate rise in payments of business services.
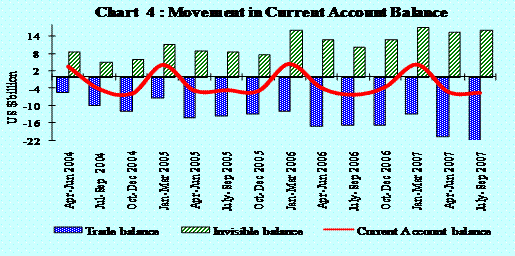
Current Account Deficit - Despite an invisible surplus, the current account deficit increased to US $ 10.7 billion in April-September 2007 from US $ 10.3 billion in April-September 2006 due to higher trade deficit on account of deceleration in exports and higher non-oil imports (Chart 4).
Capital Account - Under net capital flows (Table 7), portfolio investment, external commercial borrowings (ECBs), banking capital and short-term trade credit showed higher growth during April-September 2007.
| Table 7: Net Capital Flows during April-September 2007 (US $ million) | | Item | April-September | April-March | | 2007-08 | 2006-07 | 2006-07 | 2005-06 | | 1 | 2 | 3 | 4 | 5 | | 1. Foreign Direct Investment | 3,880 | 4,491 | 8,479 | 3,034 | | 2. Portfolio Investment | 18,334 | 1,644 | 7,062 | 12,494 | | 3. External Assistance | 729 | 386 | 1,767 | 1,702 | | 4. External Commercial Borrowings | 10,557 | 5,735 | 16,155 | 2508 | | 5. NRI Deposits | -78 | 2,210 | 4,321 | 2,789 | | 6. Other Banking Capital | 5,341 | 1,133 | -2,408 | -1,416 | | 7. Short-term Trade Credits | 5,711 | 3865 | 6,612 | 3,699 | | 8. Rupee Debt Service | -44 | -67 | -162 | -572 | | 9. Other Capital @ | 5,978 | -241 | 3,953 | 1,232 | | Total (1 to 9) | 50,408 | 19,156 | 45,779 | 25,470 | | @ include items shown in Table 8 | - Net foreign direct investment (FDI) into India at US $ 9.9 billion during April-September 2007 (US $ 7.3 billion in April-September 2006) accelerated on the strength of sustained domestic activity and positive investment climate with inflows channeling into manufacturing, business and computer services. Outward FDI at US $ 6.0 billion during April-September 2007 (US $ 2.8 billion in April-September 2006) increased, reflecting the preference of the Indian companies for global expansion in terms of markets and resources. Thus, net FDI inflows at US $ 3.9 billion during April-September 2007 were lower than US $ 4.5 billion in April-September 2006.
- Net ECBs at US $ 10.6 billion during April-September 2007 (US $ 5.7 billion during April-September 2006) were enabled by lower interest rates on external commercial borrowings and rising financing requirements for domestic capacity expansion.
- As alluded to earlier in Box 1, the data on suppliers' credit up to 180 days has now been included under the short-term trade credit since 2005-06. Net Short term trade credit was at US $ 5.7 billion (inclusive of suppliers' credit up to 180 days) in April-September 2007. Out of total short-term trade credit (US $ 5.7 billion), the suppliers' credit up to 180 days amounted to US $ 1.9 billion during April-September, 2007.
- Banking capital showed higher inflows during April-September 2007, reflecting the drawdown of assets held abroad by the banking system.
- There was a net outflow on account of NRI deposits during April-September 2007 as the interest rates on such deposits have been reduced in the recent period.
- 'Other capital' transactions comprise lead and lags in exports, funds held abroad, advances received pending issue of shares under FDI and other capital receipts not included elsewhere. The transactions under other capital not included elsewhere mainly constitute cross border transactions relating to financial derivatives and hedging (margin payments and settlement), migrant transfers and other capital transfers (such as transfers of capital assets by the Indian migrants abroad, investment grants, payments of compensation), realisation of guarantees etc. (Table 8).
| Table 8: Details of 'Other Capital' (Net) (US $ million) | | Item | April-September | April-March | | 2007-08 | 2006-07 | 2006-07 | 2005-06 | | 1 | 2 | 3 | 4 | 5 | | 1. Lead and Lags in Exports | 3,688 | 202 | 773 | -564 | | 2. Net Funds Held Abroad | -1,820 | -1,032 | 496 | 236 | | 3. Advances received Pending Issue of
Shares under FDI | 2,010 | - | - | - | | 4. Other capital receipts not included elsewhere
(Inclusive of derivatives and hedging, migrant
transfers and other capital transfers) | 2,100 | 589 | 2,684 | 1,560 | | Total (1 to 4) | 5,978 | -241 | 3,953 | 1,232 | Reserves Accretion - Net accretion to foreign exchange reserves on a BoP basis (i.e., excluding valuation) at US $ 40.4 billion during April-September 2007 was enabled by strong capital inflows, notwithstanding a current account deficit (Chart 5). Taking into account the valuation gain of US $ 8.2 billion, foreign exchange reserves recorded an increase of US $ 48.6 billion during April-September 2007 as against an increase of US $ 13.7 billion during the corresponding period of the previous year [A press release on sources of accretion to foreign exchange reserves is released separately].
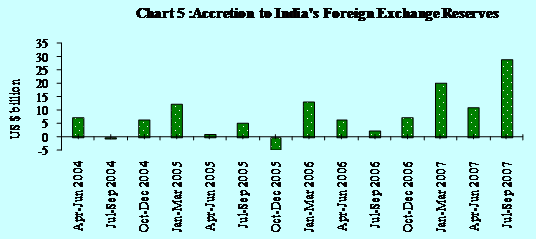
- At the end of September 2007, the outstanding foreign exchange reserves stood at US $ 247.8 billion.
III. Revisions in the BoP Data for 2005-06, 2006-07 and first quarter of 2007-08 According to the Revision Policy announced on September 30, 2004, the data for 2005-06, 2006-07 and the first quarter of 2007-08 have been revised based on latest information reported by various reporting entities. The revised data are presented in the standard format of BoP presentation in Statement II. As mentioned earlier, the potential overlap between business services and software services for 2005-06 and 2006-07 were reviewed and based on the feedback from the ADs, the revisions have been carried out in various components of business services. The revised data on business services are set out in Table 9. | Table 9 : Revisions in the Data on Business Services (US $ million) | | Item | 2006-07 | 2005-06 | | Published | Revised | Published | Revised | | 1 | 2 | 3 | 4 | 5 | | 1. Business Services
Receipts | 23,459 | 19,266 | 12,858 | 9,307 | | 2. Business Services Payments | 20,200 | 17,093 | 10,496 | 7,748 | | 3. Net (1 - 2) | 3,259 | 2,173 | 2,362 | 1,559 | IV. Reconciliation of Import Data Historically, the reason for the difference in the RBI and the DGCI&S data were due to coverage of data relating to defence, aircrafts, ships, petroleum and valuation and timings. It may be noted that except for defence data, the DGCI&S data now includes all other items such as aircrafts, ships and petroleum (based on Customs data) in the imports. During April-September, 2007 based on records of the DGCI&S imports data and the BoP merchandise imports, the difference between the two data sets works out to US $ 4.2 billion as compared with US $ 7.9 billion during the corresponding period of 2006-07. The difference between the BoP merchandise imports and the import data of DGCI&S for the fiscal year 2006-07 works out to US $ 5.6 billion (Table 10). | Table 10 : DGCI&S and the BoP Import Data (US $ billion) | | Item | April-September | April-March | | 2007-08 | 2006-07 | 2006-07 | 2005-06 | | 1 | 2 | 3 | 4 | 5 | | 1. BoP Imports | 116.1 | 95.2 | 191.3 | 157.1 | | 2. DGCI&S Imports | 111.9 | 87.3 | 185.7 | 149.2 | | 3. Difference (1-2) | 4.2 | 7.9 | 5.6 | 7.9 | V. External Debt for the Quarter ending September 2007 As per the existing practice, the external debt for the quarters ending March and June are compiled and released by the Reserve Bank of India, while the external debt for quarters ending September and December are compiled and released by the Ministry of Finance, Government of India. Accordingly, the data on external debt for the quarter ending September 2007 are being released by the Ministry of Finance, Government of India today.
|
|